A3: Play with Spreadsheets
- Due: Nov 07 11:59PM (EST)
- Groups of 1 or 2 students
In this assignment, you will use two spreadsheet interfaces. The first is Ultorg (production version of SIEUFERD), and the second will be a commercial spreadsheet-based visual analysis system of your choosing.
Similar to previous assignments, the purpose is to gain exposure to a novel HDI system. Try your best to learn how to use the system through the paper and videos, and ask questions on slack!
Thanks to Eirik Bakke for sharing Ultorg and helping put together this assignment.
Ultorg
You will try out Ultorg, a visual query interface for relational databases. Ultorg is the commercial successor to the SIEUFERD project at MIT, as described in the SIGMOD ‘16 paper: Expressive Query Construction through Direct Manipulation of Nested Relational Results
Watch the query system demo from the SIGMOD paper:
Installation
The Ultorg software is a desktop application which runs on Windows, MacOS, or Linux. It is currently under development; you will be playing with a beta version.
By October 25, you should have received an email with a link to download a beta version of the Ultorg software. If not, you can email Eirik Bakke (ebakke@ultorg.com).
The email will include instructions for starting the application and opening the demo database, which is an academic course catalog containing several semesters’ worth of data from Princeton University.
We will ask you to take screenshots of queries that you produce for this exercise.
Background
Ultorg is a direct manipulation interface for creating queries and visualizations over an arbitrary relational database. Relational databases tend to have many tables of data, representing business entities and the relationships between them. In typical business scenarios, it becomes necessary to visualize these relationships from a number of different “perspectives”, depending on the business task at hand. Ultorg lets users create such perspectives without custom coding.
In Ultorg, a perspective is a single concept that defines both a database query and its visualization (formatting). Possible perspectives include the visual equivalent of any SQL-92 query, visualizations such as crosstabs, calendars, bar charts, and kanban boards, as well as non-tabular multi-query visualizations such as forms, dashboards, and hierarchical reports. This covers every kind of data display that is seen in traditional tailor-made database applications.
Your Task
Your task is to produce the following perspectives in Ultorg, based on the “course catalog” demo database. For each of the perspectives, take a screenshot to paste into a PDF that you will submit as your report. The cool part of Ultorg is that the layout is the query, thus a screenshot is sufficient!
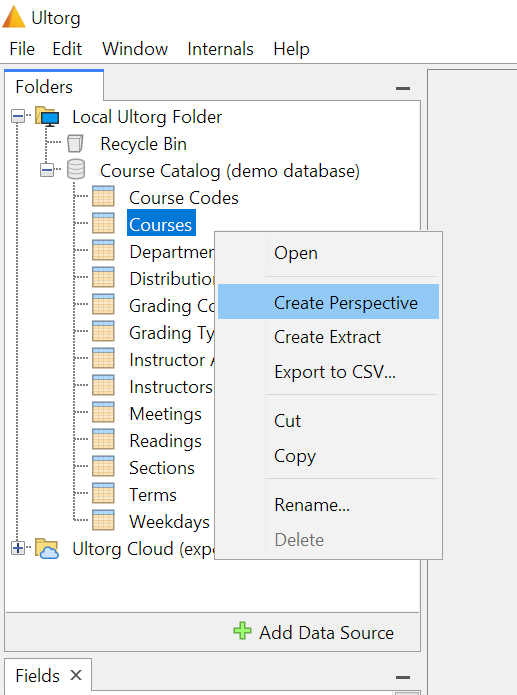
To get started, open Ultorg and click “Add Data Source”, then “Connect to Demo Database”. Expand the “Course Catalog (demo database)” icon to see the tables in the database. Right-click a table and click “Create Perspective” to create a new query:
Perspective 1
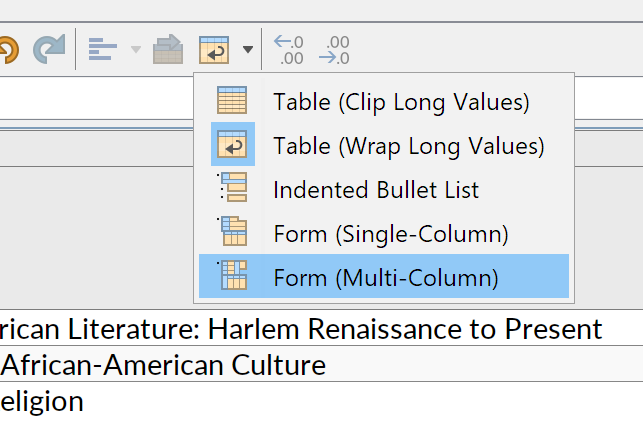
Show a list of courses, including all available information for each course, including meeting times, instructors assigned to each meeting, and assigned readings. Filter to include the term “S06-07” only. Show the results using a multi-column form-style layout:
Perspective 2
Show a list of instructors, ordered descending by total time assigned to non-canceled meetings (“status” not equal to “X”), along with the courses taught by each instructor, laid out in a tabular fashion. Show the total teaching time for each instructor as a separate table column, with a bar chart visualization. Filter to include the term “S06-07” only.
For finding the length of a section in hours, use the formula diffDayFract([End Time], [Beg Time]) * 24.
Perspective 3 (optional and encouraged!)
Show a list of professors (instructors) who tend to assign their own textbooks as reading materials for their classes. (You can match author names exactly, or try to be more clever.)
Hints
-
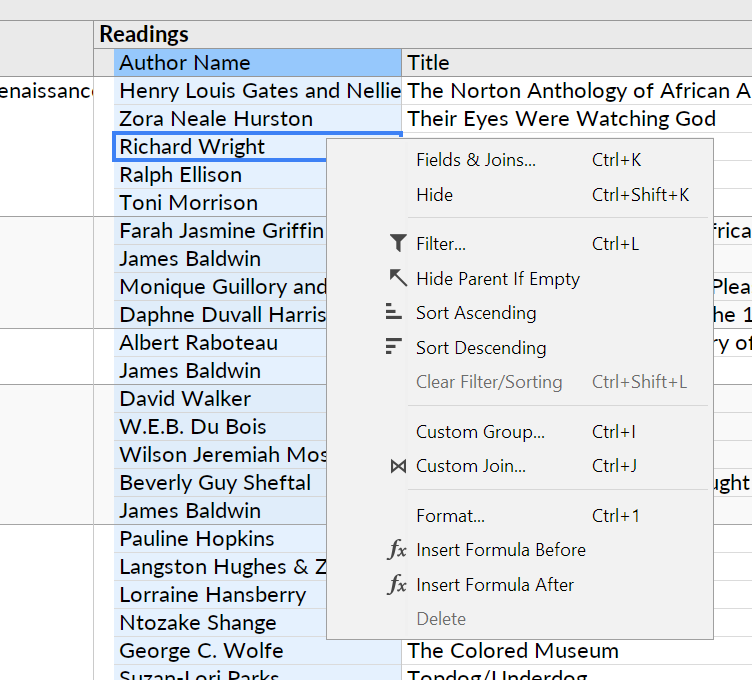
You can right-click on any column of data in the output pane to open the context menu. All query-related actions are initiated from this menu.
-
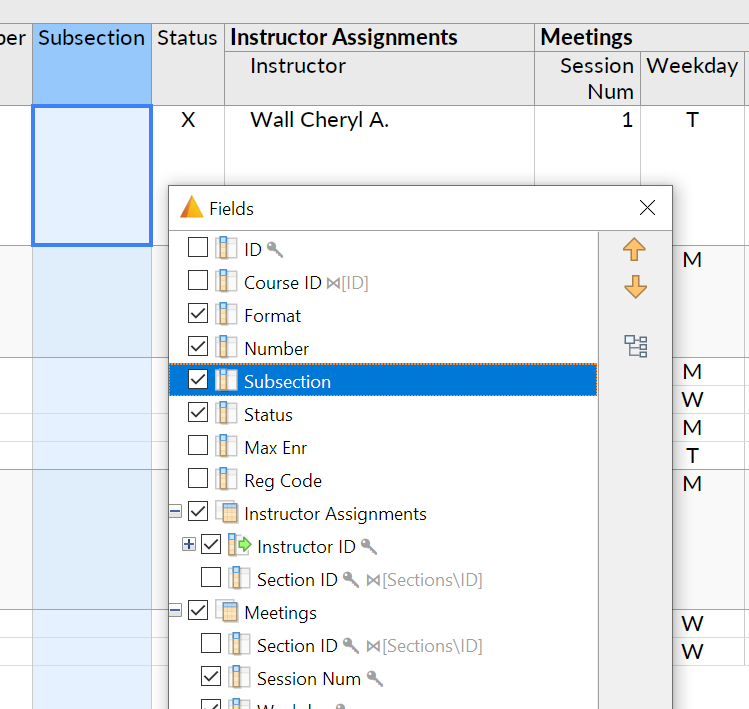
The “Fields” popup (opened via “Fields and Joins…” in the context menu) is frequently used.
-
In the “Fields” popup, you can hold down shift or to select multiple fields, and press space to check/uncheck them all.
-
While editing a formula, you can click around to insert new references, like in a spreadsheet.
-
You will also need the SUM function
Play With Another Tool
You will now try out another spreadsheet interface. Install/register and use one of the following tools
- Dataspread (kind of complicated)
- Sigma computing
- Airtable
- You can propose another interface. Message Professor Wu on Slack with your proposal at least a week before the deadline.
Your task is to
- Load some data into the interface. You can pick your own data, or use data from the COVID tracking project
- Explore the data using the interface and make two observations about the data. Following the paper based on Bloom’s taxonomy of understanding, make one observation at the Evaluation level, and one observation at the Synthesis level.
Submision Instructions
- Create a single PDF containing screenshots of your Ultorg perspectives
- Rename your pdf to
a3_<UNI>.pdf
- Rename your pdf to
- Fill out this Google Form